Welcome to Metrics and Reports by SolveroX
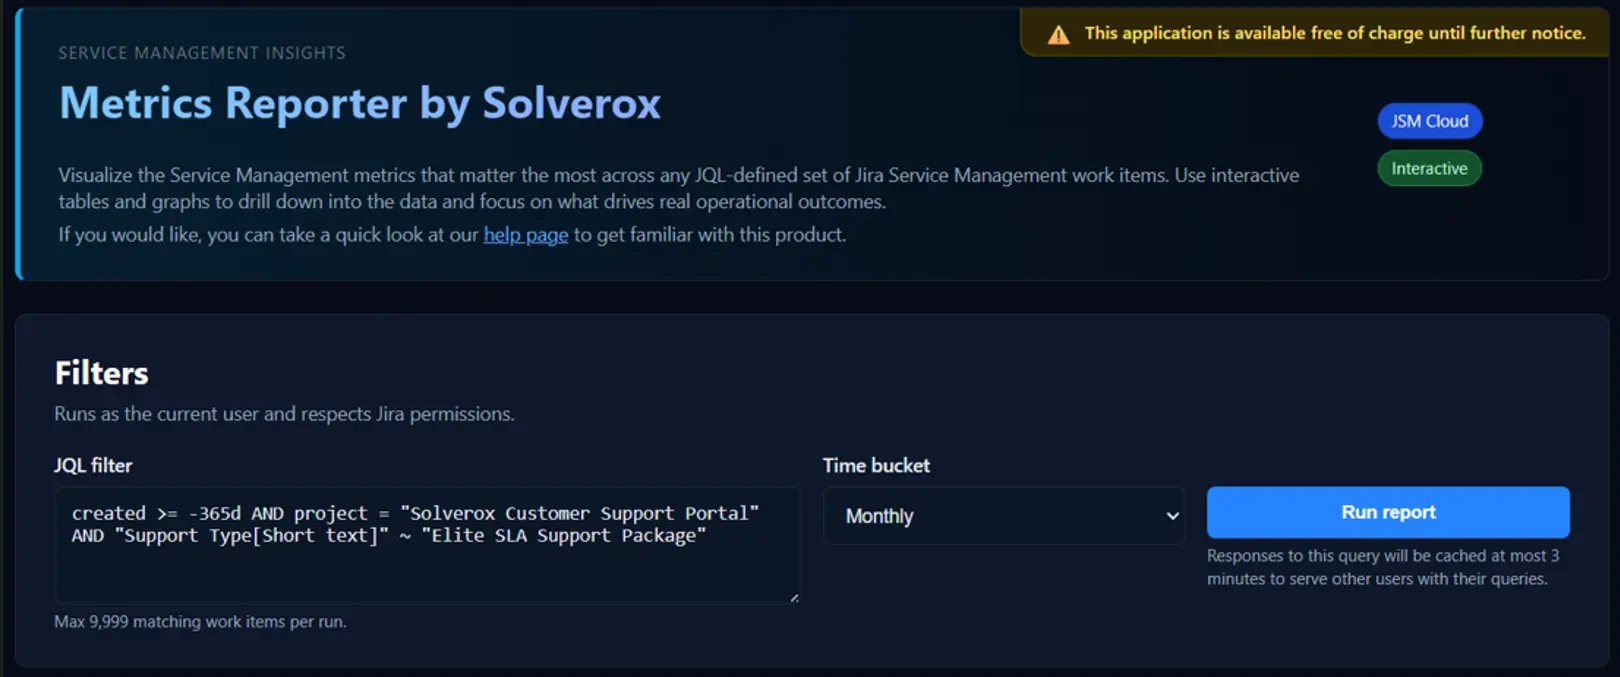
Metrics and Reports is an app available on the Atlassian Marketplace that works exclusively with Jira Service Management (JSM) projects. It provides the fastest way to report on response and resolution times, SLAs and customer satisfaction metrics for any Jira work items that match your Atlassian-approved JQL. Simply enter your query, select a time range, and instantly generate JSM reports with tables and charts showing SLA success rates, CSAT scores, status distribution, and resolution breakdowns - no data exports or spreadsheets required.
Please visit the FAQs below to get a conprehensive understanding on how this application works. You can also visit https://www.solverox.com/MetricsReporter/ to get a broad understanding of the product capabilities.
1-minute user video
Please see our video on Youtube: https://www.youtube.com/watch?v=-hp47BZqFWk
What do I see in these reports?
You see the three most important metrics to Service Delivery:
- In the first section called "Bucketed Metrics", you see the response/resolution times, their SLA metrics and the satisfaction ratings from your customers. All the graphs and tables are interactive.
-
In the second section called "Time on each status", you see the time spend on each status. This will show
you what consumes the most of the time. Examples: Are you waiting more for your customers or more for your
support team? How much time do you spend on the "escalated" work items comparing to other statuses?
If some teams own more than one status, you can write mathematical equations like "development team=escalated+testing" to see how much development team spend on work items and compare their time spend with other teams.
- In the third section called "Total vs resolution", you see the volume for each resolution type comparing to the total volume. For example: Out of the total work items per your time period, how many of them were "software failures", how many of them were resolved just by pointing to the documentation (resolution type="working as documented"). This will provide you deeper insights on what to do strategically to improve the level of support delivery and customer experience currently being provided.
Example JQLs to use
- How is our team doing overall since the beginning:
project = Helpdesk - How is our team doing overall regarding only the closed work items in our own Jira project:
project = Helpdesk AND status = Closed - How am I (or is Kevin) doing this year:
project = Helpdesk AND assignee = 557058:a311c218-80fc-4184-8cf2-d5ce9b847506 AND created >= -365d - How was our service to Acme Corp in months:
project = Helpdesk AND Organizations = "ACME Corp" AND created >= -365d - How is our service delivery for our customers with "Elite Support" Package:
project = Helpdesk AND "Support Type[Short text]" ~ "Elite SLA"
Note: Please write your JQL in Jira - Advanced JQL search bar and make sure it works there before copying and using it here.
Dont know how to write JQL: Consult with a well-known AI assistant and ask it to write it for you. Just make sure that you have project=your_project_name in your JQL to keep the report only for your project.
What is the easiest way to verify that this application provides perfectly correct metrics?
- Enter a JQL for a single Jira work item that you want to make the calculations detailly. Example:
key = SUPPORT-27876 - Fill in all the statuses one by one for the "Time on each status" report. Example:
c=waiting for customer
s=waiting for support
i=in progress
e=escalated
p=pending
collective=waiting for customer+waiting for support+in progress+escalated+pending - Do your calculations manually or share:
- screenshot of the entire work item history
- screenshot of your SLA definitions
- screenshot of the entire report we generated to your well-known AI, and ask it to calculate the results for you.
This will make you fully confident on how our calculations work flawlessly.
PS: Please remember that this application is designed for JSM projects only. If you see any discrepancy, please share the same info (not any confidential info) with us and let's see together.
How can I see the details of the metrics or verify the metrics I see?
- Click on the table row to see the details.
- Click on any graph bar to see which work items are used to build that graph bar.
How are authorization and security?
- This application is available only to Service Desk Agents defined on your Jira instance.
- Users can see the reports produced from only which jira work items they are authorized to see. That's why the report of an Agent can be different than the report of an other agent, even though they use the same JQL.
What am I seeing exactly in the "Details..." table? Why may I see different work items when I click on table vs graph?
- When you click one of the rows in the Bucketed metrics table, you see all the work items that went into that bucket. But for some of the metrics in that bucket, some work items may not have contributed, because they did not have the relevant data.
- When you click any of the bars of any graphs, you see only the work items that are used to calculate the graphs. It is best to review the next FAQ after this one.
How do the calculations work?
For all calculations, only the metrics provided are used. For example, if a work item has first response time but it is not yet resolved, it only contributes to first response and first time SLA metrics. If you want to exclude "undone" work items or only include the items with, let's say, status = Closed, you need to define it in the JQL.
All calculations in the reports respect the SLA timers and calendars as long as they are defined. If for any of the metrics reported you do not have SLA calendar defined, those metrics are calculated based on wall-clock time.
What is so special about "Time to done"? How to create "Time to Done SLA"?
When you create your Jira instance, by default, usually these three statuses are considered as "Done" in the workflow:
- Cancelled
- Resolved
- Closed
PS: Many organizations modify this workflow so that only "Closed" is considered as "Done".
When you create your Jira instance, by default, usually only these SLAs are defined:
- Time to First Response
- Time to Resolution
- If you do not define Time to Done SLA, your Time to Done metric will calculate the time between the work item creation and the latest status change to any of the "done" statuses using wall-clock.
- If you do define Time to Done SLA, your Time to Done metric will calculate the time between the work item creation and the latest status change to any of the "done" statuses respecting your Time to Done SLA timer.
If you are using your Jira instance with the defaults (there is Time to Resolution SLA; there is no Time to Done SLA; Cancelled, Resolved and Closed are all considered as done):
- "Time to resolution" respects the SLA calendar, thus the "Resolution SLA success" shows the success rate as expected.
- "Time to done" shows wall-clock timing for the same work item set.
To see how Time to Done SLA can be defined, please review the sample below.
What does ZZZ issues in error mean?
Issues in error are the work items for which we hit an explicit fetch failure, a parsing failure on returned data, or a structurally invalid Jira payload that prevented us from using the data correctly. Some of these are transient issues that we already retried a few times to resolve, but not all of them are always resolvable. If there is any data, even partial, that we could fetch for those work items, we still use the partial data, but if we have some missing data, even partial, we are informing you that your report may not be 100% accurate. If you see a high number of issues in error, please contact us - your expectation should be to see 1-2 errors per 1,000,000 issues.
Why do I see "0m" for some of my work items?
- You either have a very sophisticated AI Agent, like TS AI Agent by SolveroX, which listens to your Jira queues, navigates through your work items, and provides near-instant replies to your customers' questions.
- Or your SLA calendar does not count the time because the work items you investigate are outside of the SLA calendar they are tied to, thus the timer is not working (normal).
None of these two? We are always here to help: [email protected].
Why do I see "-" for some of my work items?
Your Jira instance is not collecting this specific information for the specific project you are reporting on.
For example, if you see "-" for "Time to Resolution", which many organizations avoid having as an SLA, you either deleted your Time to Resolution SLA, or did not define a goal to make "Time to Resolution SLA" active. You can still use "Time to Done" to see the time that passes between issue creation and transitioning to "Done" status. Please check the other FAQs about "Time to Done" as well to see how it works.
Why do I see a red colored "i" badge on my graphs?
There are actually 3 different scenarios about the badges:
- No badge: When there is data to show, or the metric shown is fully SLA-backed
- "There is no SLA data for this metric, thus the calculation used wall-clock": There is data to show but none of the data presented was SLA-backed
- "Some work items used SLA, and some used wall-clock because relevant SLA data was not available for all work items": There is data to show but some of the data presented was SLA-backed and some not. This usually happens if you added your SLA definition sometime that falls within the report period, that's why some work items have the SLA info attached to them and some not.
What is "Time on each status"? What are the best examples to utilize it.
Many organizations want to see the time spent on work items by department, or compare their own teams versus their customers. Here, you can provide a basic mathematical equations for your table/graph labels to be generated:
my bucket name that will show as graph label = Average of (status_1 + status_2 + ... + status_n)status_n = Sum of all statuses that equals to status_n in a jira work itemLet's say we focus on two work items, SUPPORT-1 and SUPPORT-2. Let's assume SUPPORT-1 moved to "waiting for support" twice, and it stayed in this status first for 6 minutes and second for 4 minutes, so SUPPORT-1's "waiting for support" total is 10 minutes. SUPPORT-1 never moved to "pending". SUPPORT-2 moved to "waiting for support" only once (30 minutes) and to "pending" only once (20 minutes).
This is what we expect to see in the graph: SUPPORT-1 waiting for support = 6m + 4m = 10 minutes; 0 minutes for pending. SUPPORT-2 waiting for support = 30 minutes; 20 minutes for pending.
The average you would see for "waiting for support" = 10 minutes for SUPPORT-1 + 30 minutes for SUPPORT-2 = 40 minutes / 2 work items = 20 minutes. The average for "pending" = 0 minutes for SUPPORT-1 + 20 minutes for SUPPORT-2 = 20 minutes / 2 work items = 10 minutes. The table/graph uses the rolling period you picked and respects the correct time frames.
Please remember that the table/graph uses the rolling period you picked and respects the time frames you specified in the intial JQL that you requested report for.
Here are some examples to build your table/graphs (you can create up to 10 different labels):
- Waiting for Customer = waiting for customer → shows how much (average) your work items wait for customers to come back to you.
- Waiting for SolveroX Support = Waiting for support → shows how much (average) your work items wait for your support team.
- Waiting for SolveroX Development = Escalated + In Progress + pending → shows how much (average) your development or product teams work.
What if I dont have capability to manage Jira in house?
SolveroX provides consultancy on Jira, calendars, SLAs, Automations or other subjects that you may need to get the maximum benefit from the applications that SolveroX builds. Please contact us at [email protected]
What is your pricing policy?
This application is currently available free of charge, but we plan to transition to a paid model in the future. When this happens, we will have clear communication on the pricing policy and grace period for the existing users.
Open Source Credits
Metrics and Reports (JSM) is built using incredible open-source software. We are grateful to the following projects:
- React (MIT License) - UI Framework
- Recharts (MIT License) - Data Visualization
Full license notices for these components are available in their respective public repositories and documentation.
How do I contact support?
Please reach us at [email protected].
What is your official web page?
Please visit us at solverox.com